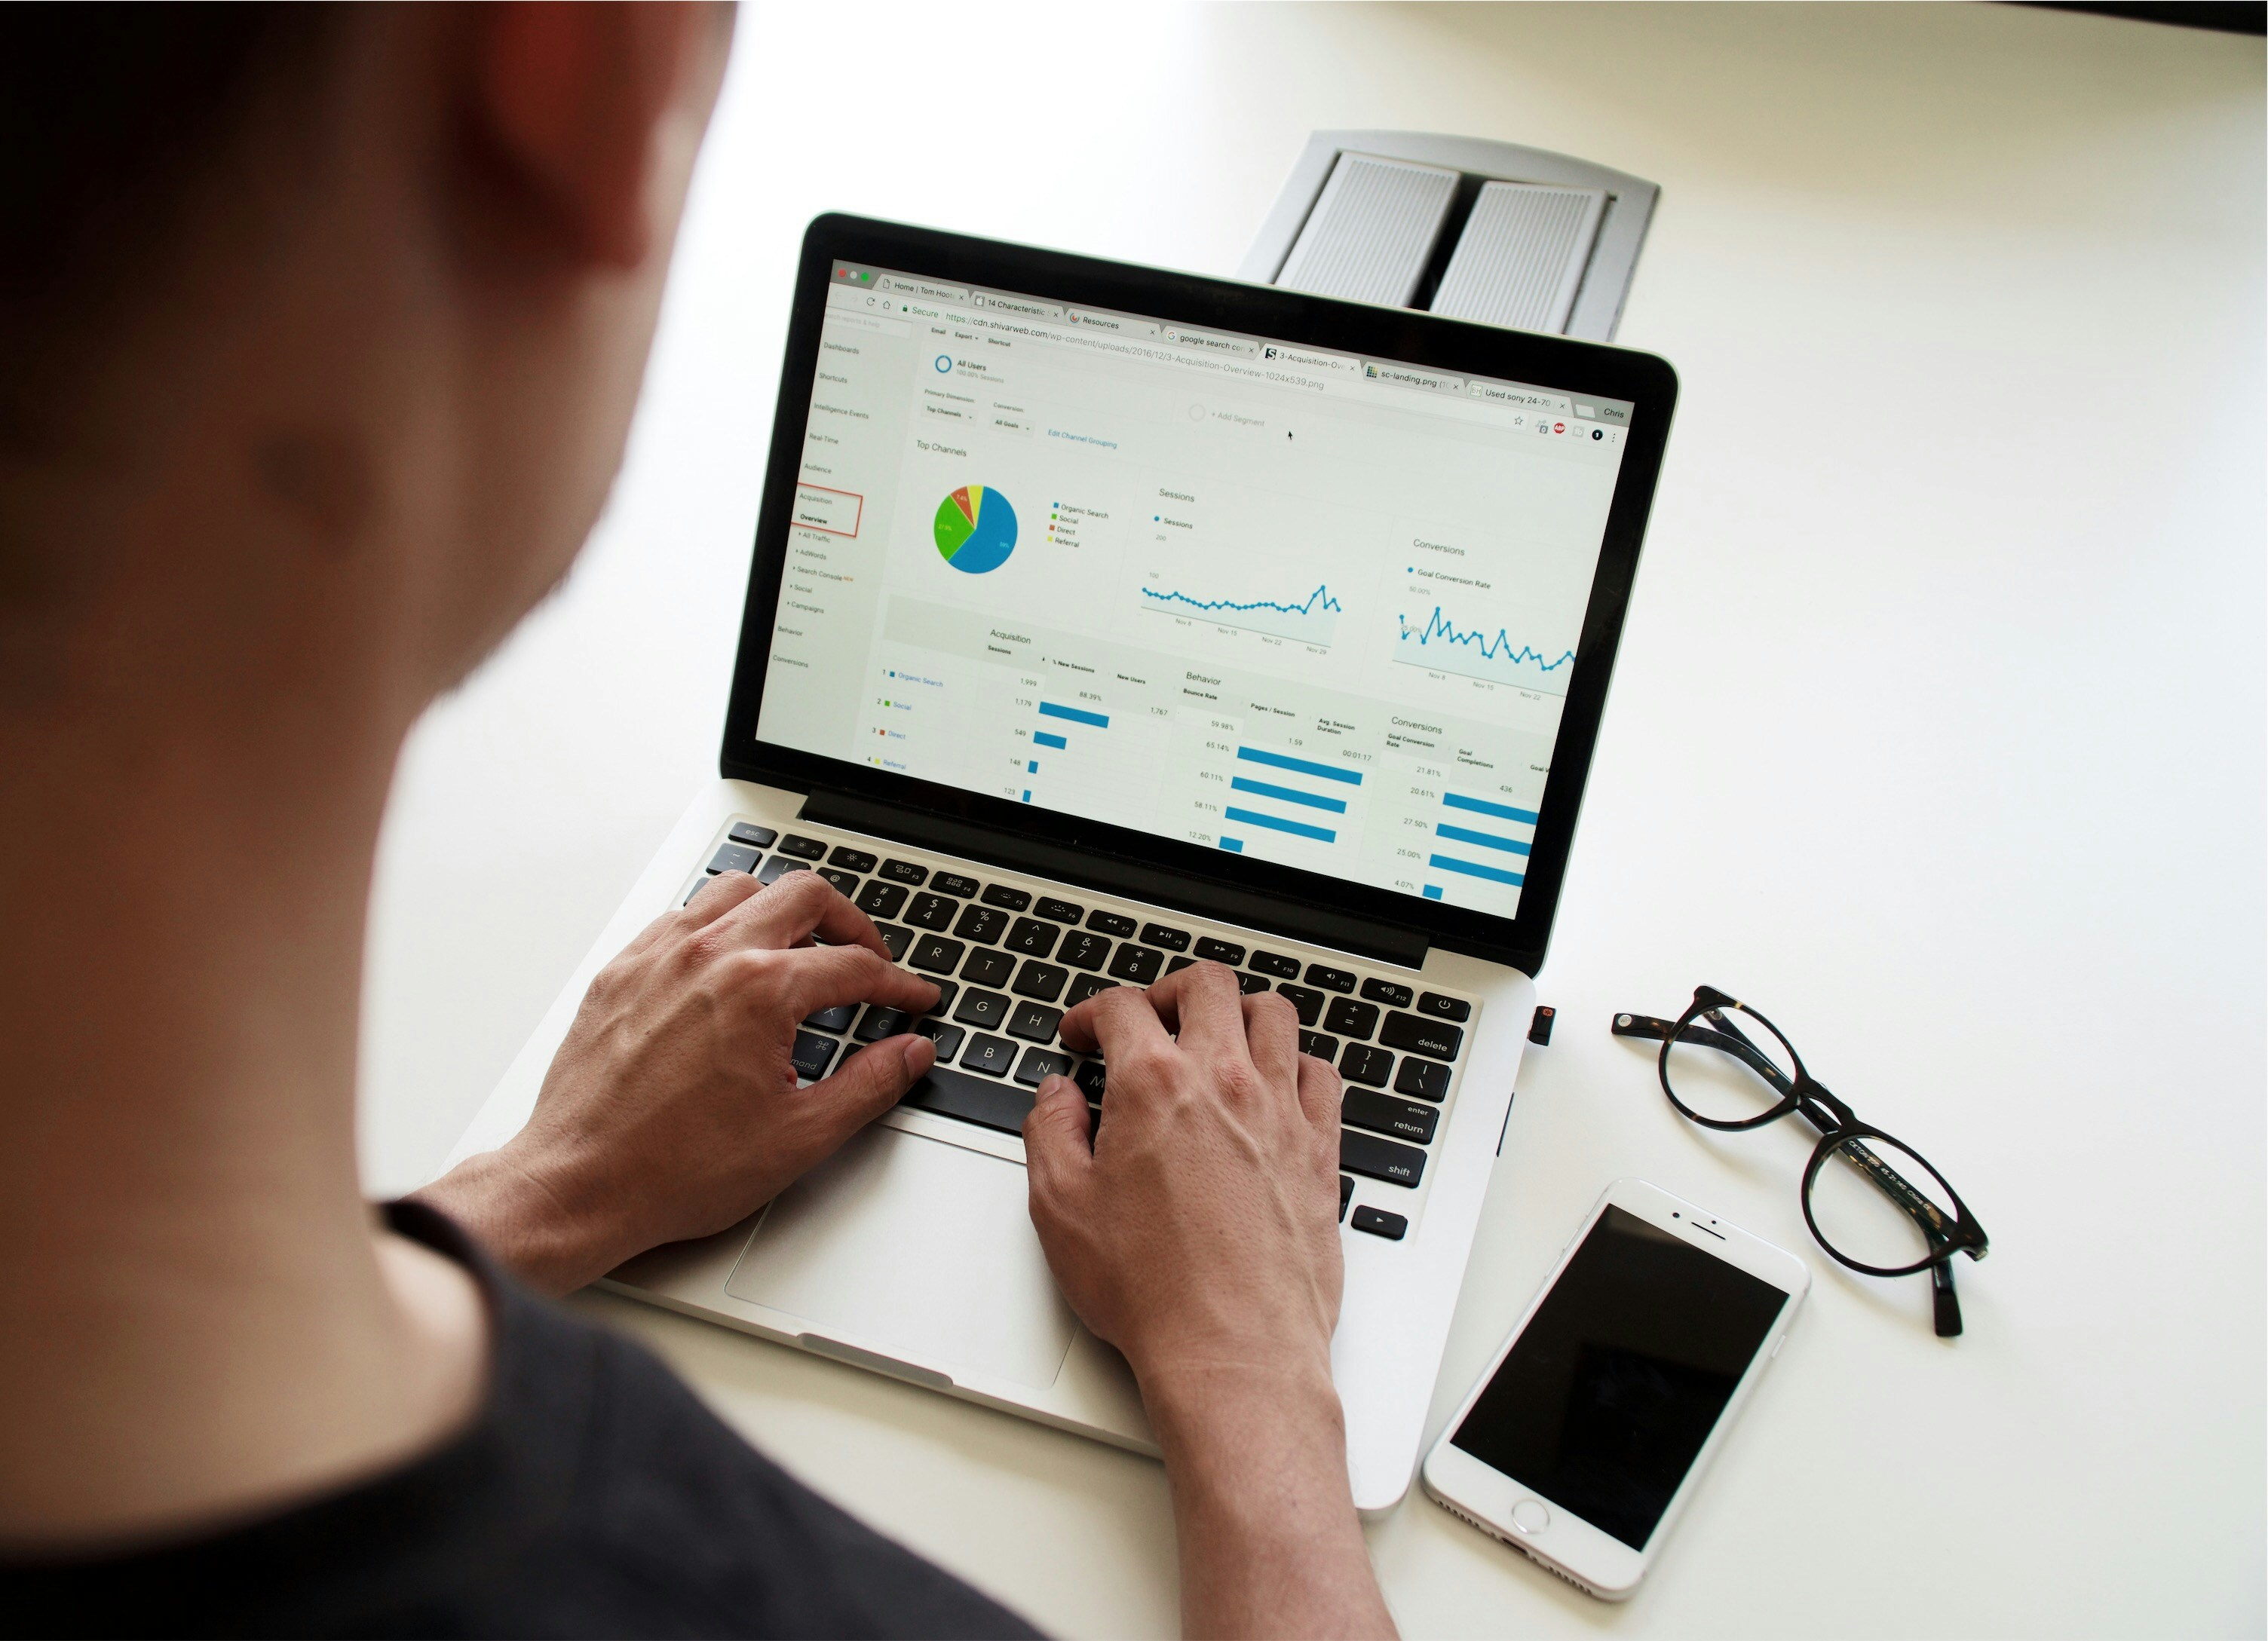
Track Disinformation in Real Time

Access disinformation trends with our disinformation dashboards using cutting-edge tools for analysis, tracking, and reporting.
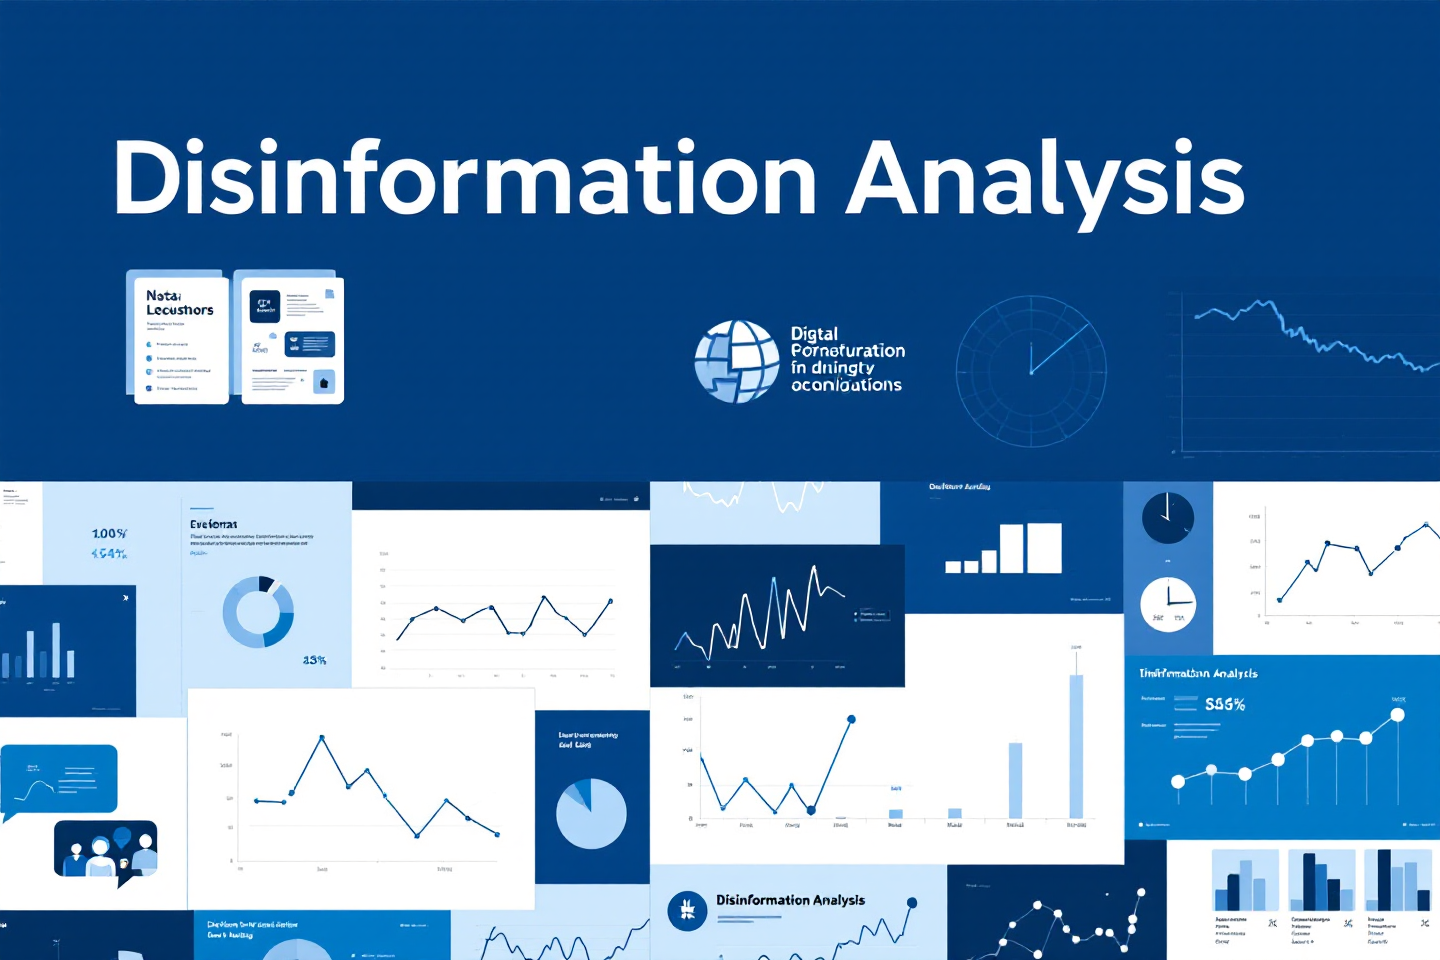
Click through the tabs to view data panels and insights.

Visualize Disinformation Spread

Track the geographic origins and spread of disinformation across the Balkans and beyond. Drill down to explore specific narratives, their sources, and engagement levels—all in real time.

Monitor Trending Narratives

Stay ahead of the curve with a dynamic overview of trending disinformation narratives. Categorized by sentiment, reach, and engagement, these insights empower you to track narrative evolution over time.

Understand Disinformation Categories

Delve into detailed visualizations of disinformation types, including political propaganda, health misinformation, and social polarization. Categorized insights help you focus on areas of highest impact.

Analyze Public Sentiment

Discover how the public perceives and reacts to disinformation narratives with sentiment trends. Interactive line graphs display evolving attitudes toward specific topics.

Find Exactly What You Need

Refine your search for disinformation insights with advanced filtering options. Explore narratives by keywords, regions, timeframes, or engagement levels.

Generate and Share Insights

Create custom reports and export raw data for your own analysis. Subscribers also receive weekly Disinformation Intel Briefs to stay updated on the latest trends.

The Narrative Catalogue is a structured collection of disinformation narratives identified through Sensika media monitoring platform. It helps track and analyze false or misleading stories that circulate in the Balkans, providing insights into their origins, evolution, and impact.

Using a combination of keyword tracking, source categorization, and content analysisthe dashboard continuously scans media sources to detect patterns of disinformation. Each narrative is cataloged based on its themes, spread, and influence, allowing users to identify trends, assess risks, and take informed action.

Sensika’s platform is designed for anyone who wants to stay informed about disinformation trends. Whether you are a journalist tracking false narratives, a researcher studying media manipulation, or a policymaker assessing information threats, the platform provides valuable insights to help you navigate the evolving media landscape. NGOs, civil society organizations, and businesses can use it to understand and respond to misleading content that affects public trust and reputation. By offering real-time monitoring, trend analysis, and data-driven insights, the disinfo observatory empowers individuals, organizations, and decision-makers to better understand the information environment and take informed action.

The Interactive Heat Map is a powerful AI-driven tool within Sensika’s platform that visually tracks and analyzes disinformation trends across the Balkans. It works by processing vast amounts of media content in real time, using a combination of artificial intelligence, keyword tracking, source categorization, and sentiment analysis to detect and map emerging narratives.
AI algorithms continuously scan news websites and social media platforms, identifying patterns based on frequency, geographic distribution, and engagement levels. The heat map highlights regions where disinformation is most active, showing how narratives spread, evolve, and gain traction. Users can interact with the map to explore specific narratives, monitor their reach, and understand which areas or communities are most affected.

The Top Narratives Panel tracks how disinformation spreads across key political, geopolitical, social, cultural, economic, and environmental themes. Using analyst-defined taxonomies and keyword sets, it identifies and classifies misleading narratives—such as anti-democratic messages, anti-Western rhetoric, conspiracy theories, and attacks on green energy—helping to reveal patterns and impacts of disinformation.

The dashboard provides real-time data, with automatic updates refreshing approximately every 30 seconds.. The system constantly scans news websites, social media channels, blogs, and forums, ensuring that emerging disinformation narratives are detected as they unfold.
Powered by AI-driven analysis and automated monitoring, the dashboard processes and visualizes data instantly, allowing users to track trends, identify spikes in activity, and respond to disinformation as it spreads. This real-time approach ensures that insights remain current, relevant, and actionable.

Yes, Sensika’s platform offers real-time alerts on emerging disinformation narratives, allowing users to stay ahead of rapidly evolving trends. Alerts can be customized based on specific topics, regions, or keywords, ensuring that users receive relevant and timely updates. To access these alerts, users can check their subscription options.

The platform monitors disinformation across all Balkan countries, providing comprehensive coverage of the region. It analyzes media content in more than 12 languages, ensuring accurate detection of narratives across diverse linguistic and cultural contexts. Coverage of other countries is also available upon request.

We use advanced AI, including machine learning and natural language processing, to detect and analyze disinformation at scale. It automatically identifies misleading narratives, extracts key metadata, and classifies content across languages and formats. This enables timely, accurate insights into how disinformation spreads and evolves—helping users respond effectively in a fast-moving information environment.

Stay Informed. Shape the Dashboard

Join a trusted community of researchers, analysts, and policy experts.
Subscribe for exclusive updates, vetted insights, and reports on disinformation.

Tell us what you’d like to see on the dashboard. We’re building this with you in mind.

Subscription Form